What is the goal of your workflow? What problem does it solve, or how does it help you?
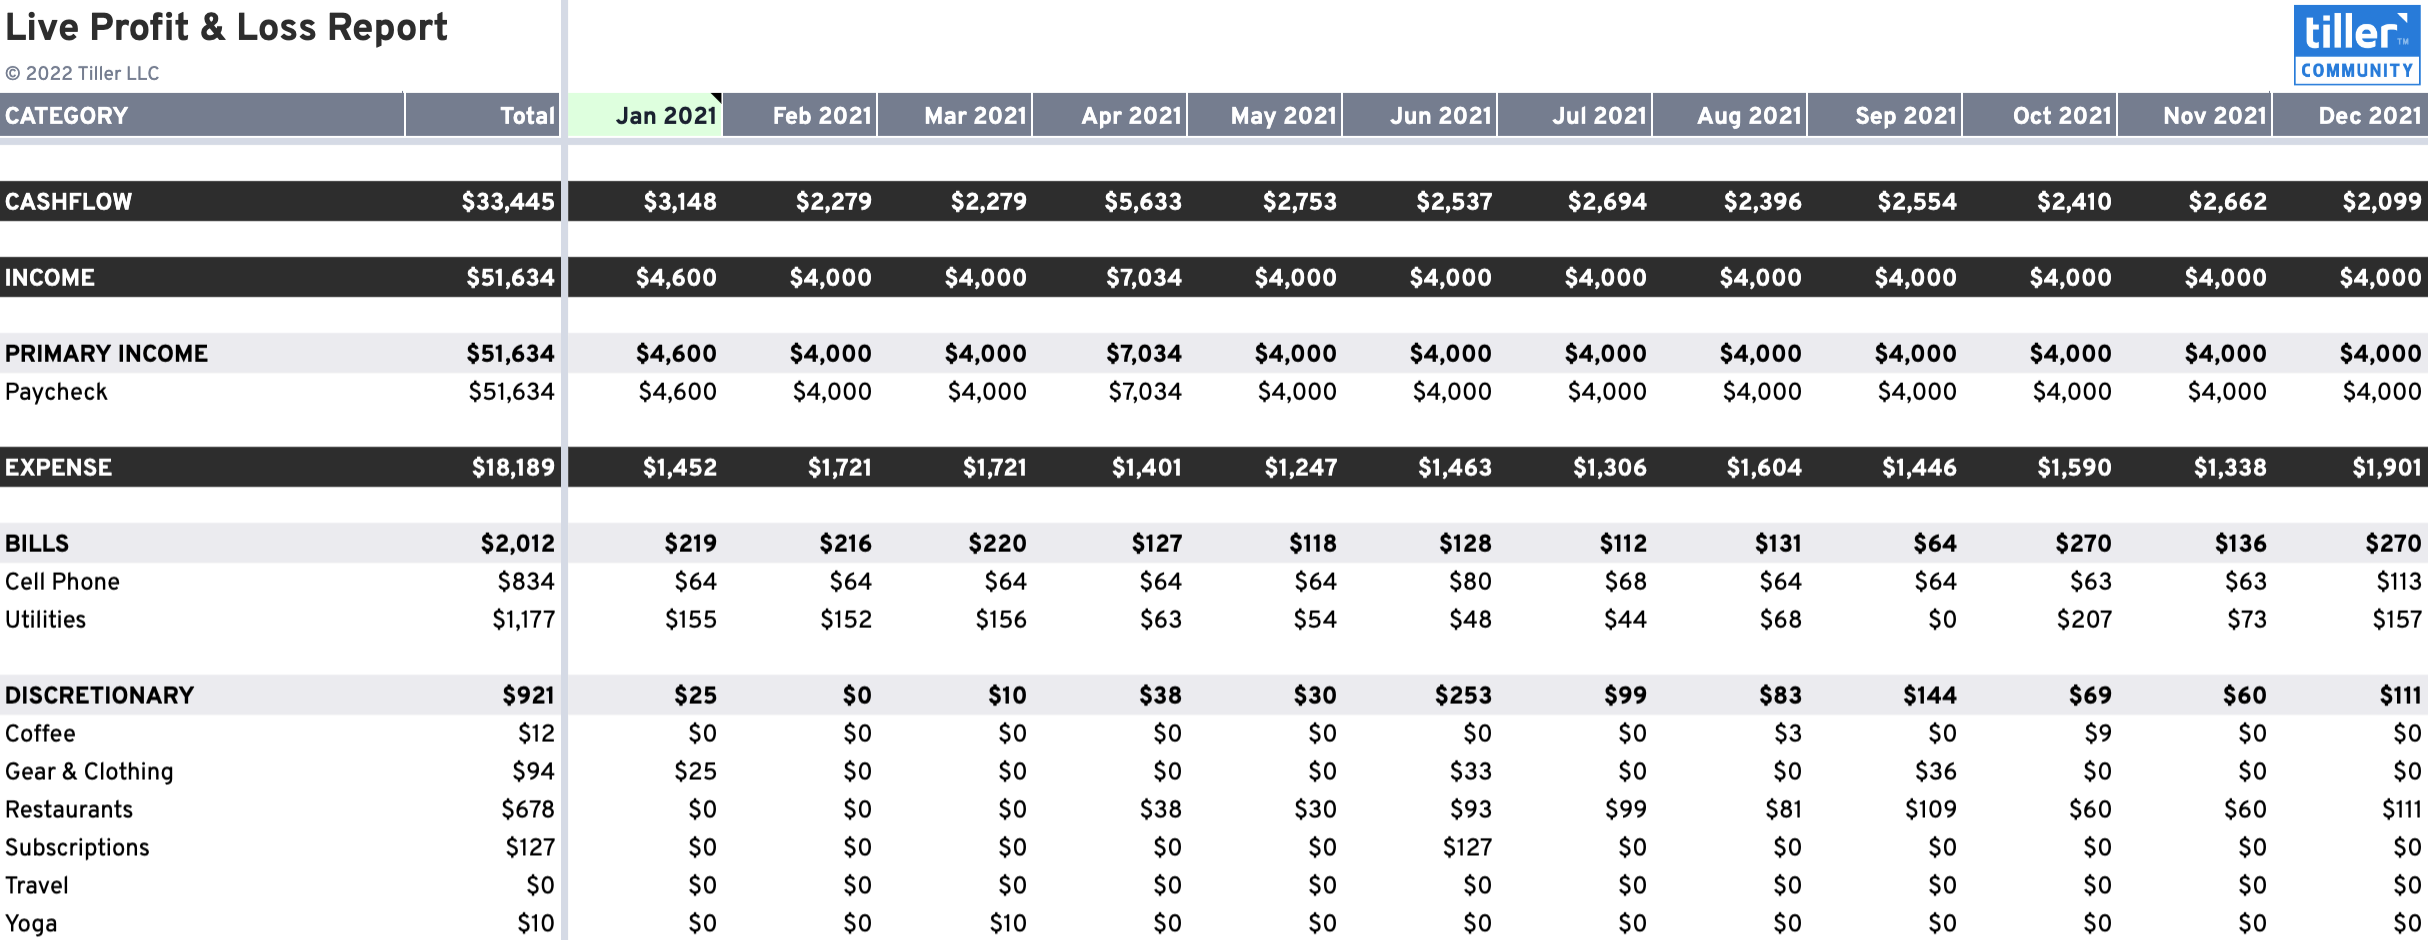
Many people want to review their spend across months and categories but the Profit & Loss Report in the Tiller Community Solutions Add-on is script-based and rigid in its implementation.
I am sharing in-sheet version of the Profit & Loss report to make it easier to customize the output to one’s needs.
How did you come up with the idea for your workflow?
The idea for this report came to me when @al1flagged some issues he was having using the script-based profit & loss report in his (large) spreadsheet.
Please describe your workflow. What are the sheets? Does it use any custom scripts or formulas?
The template is an adaptation of the Tiller Yearly Budget but without the budget and available columns. It also removes a dependency on the Monthly Budget template to make it more modular.
Anything else you’d like people to know?
It’s pretty self-explanatory, so no.
Is it ok for others to copy, use, and modify your workflow?
Please! I can imagine interesting customizations for multi-year or quarterly reporting.
If you said yes above, please make a copy of your workflow and share the copy’s URL:
You can add the template to your spreadsheet using the Tiller Community Solutions Add-on.
This is amazing! I was looking for this for a while and this just works.
One suggestion…
Since I started to use the Paycheck Workflow, I had to change the cat/group for my prior paychecks so it would still show up. The issue is that for 2022, there is a row on your report for that category, same as Bonus and other items that didn’t happen yet.
Would it make sense to only show a row where at least one month has transactions?
The template is built off the Yearly Budget. Since that template is budget-based, it makes sense to show all budgeted categories (even when there are no Actuals)… but I see your point about this one. Let me think on that, @yossiea.
I’m glad you like it, @Pete. One downside to the Live version is that it recalcs the whole sheet every time you make a change to the Transactions sheet… so there is a performance tradeoff. If you are not seeing any performance issues in your spreadsheet though, go for it!
I agree those would be cool additions, @alkrongold & @adekunledauda. My hope with exposing the calculations and doing everything in-cell is that the existing version could be a foundation for the kind of hacks and improvements you are suggesting.
Is is possible for you to add at least the same options the other P&L report had? Annual, quarterly and monthly drop downs? That would be really helpful.
@randy Thank you so much! I was looking for just this.
I had created something very similar by duplicating the Tiller Yearly Budget sheet and hiding all the Budget and Available columns. The only thing missing was the Net / Cashflow row - I had trouble adding that in myself in Tiller’s Yearly Budget sheet.
This gives me exactly what I want with the Cashflow row above the Income totals row.
The only issue I’m seeing is that the group totals are incorrect when there are both income and expense categories within the same group. It seems to not consider whether the category is income or expense when summing.
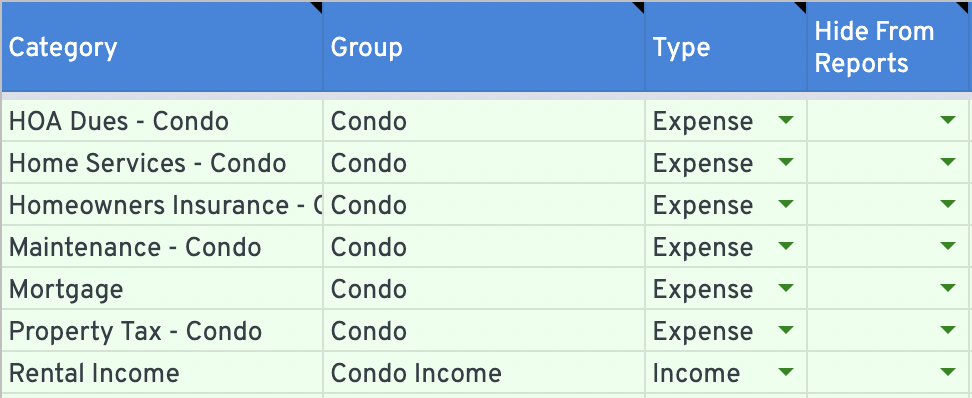
For example, I have several categories in my ‘Condo’ group. All of the categories have the Expense type except my ‘Rental Income’ category which has type Income.
Your sheet is showing that both the ‘Condo’ group income and expense totals are $495, which is the total of all the categories regardless of the category type ($2000 - $250 - $1255 = $495).
I’ve fixed this issue by changing the group for my ‘Rental Income’ category to ‘Condo Income’ instead of ‘Condo’. Now the ‘Condo’ group only has categories of one type.
Do you think you can update your sheet to consider the category type when summing for the group totals? I wasn’t savvy enough to figure it out. This works correctly with Tiller’s Yearly Budget sheet. That way we can have categories of different types in the same group. Or perhaps that is a discouraged practice?
This is a great addition. What would be nifty is to include a running monthly balance amount above the current month. To keep it simple, let’s say my annual spend limit is $120,000 or $10,000/mo. Based on how much I spend in January and February will impact my budget for the remaining 10 months (Mar - Dec). If I only spend $8,000 in Jan and Feb, I have an additional $4,000 for the next 10 months which I could spend or throw into savings.
I took a crack at updating the template to allow group-name reuse between income and expense types. Trying updating the template and let me know if it works now, @djtarazona.
@randy are you able to add the ability to group quarterly? This would be really helpful. Also, it seems like “transfer” types are included on the regular P&L report but not on the live version. Is there a way to toggle that on or off?