While the judges have weighed in on the winners for our Spreadsheet Builders Challenge, we also wanted to share feedback from a Tiller-Labs-developer perspective.
As one of the people who builds templates for Tiller Labs, I’ve reviewed the Builders Challenge spreadsheet entries from a product-design and use-of-formulas perspective. Hopefully, my feedback can help you decide whether to try submissions or inform how you might repurpose the ideas to build your own sheets. The entries sparked a few ideas for me to try too and hopefully they will do the same for other Tiller users.
We are grateful to all the people who contributed to the Builders Challenge. There was a lot of creativity and thought put into the entries. It was interesting to see how people came up with different answers and visual concepts to improve financial decision making.
While the window for submissions is closed, you can still share your financial spreadsheet ideas in the Tiller Money Community at any time.
Current Month Summary by Account

This entry is a clever set of sheets designed to help understand your current month’s actual and forecasted balances.
Highlights
- The solution provides a helpful instruction sheet.
- The sheet packs a lot of information into the Dashboard sheet.
- Shows the projected end of month balance and expected high and low balances for the month.
Consideration
- There are only 5 rows for upcoming payments, deposits, past due payments, and deposits. That might not be enough for some. (You can add more rows and manually fill down the formulas if you need more.)
The Complete Budget & Receipt Tracker
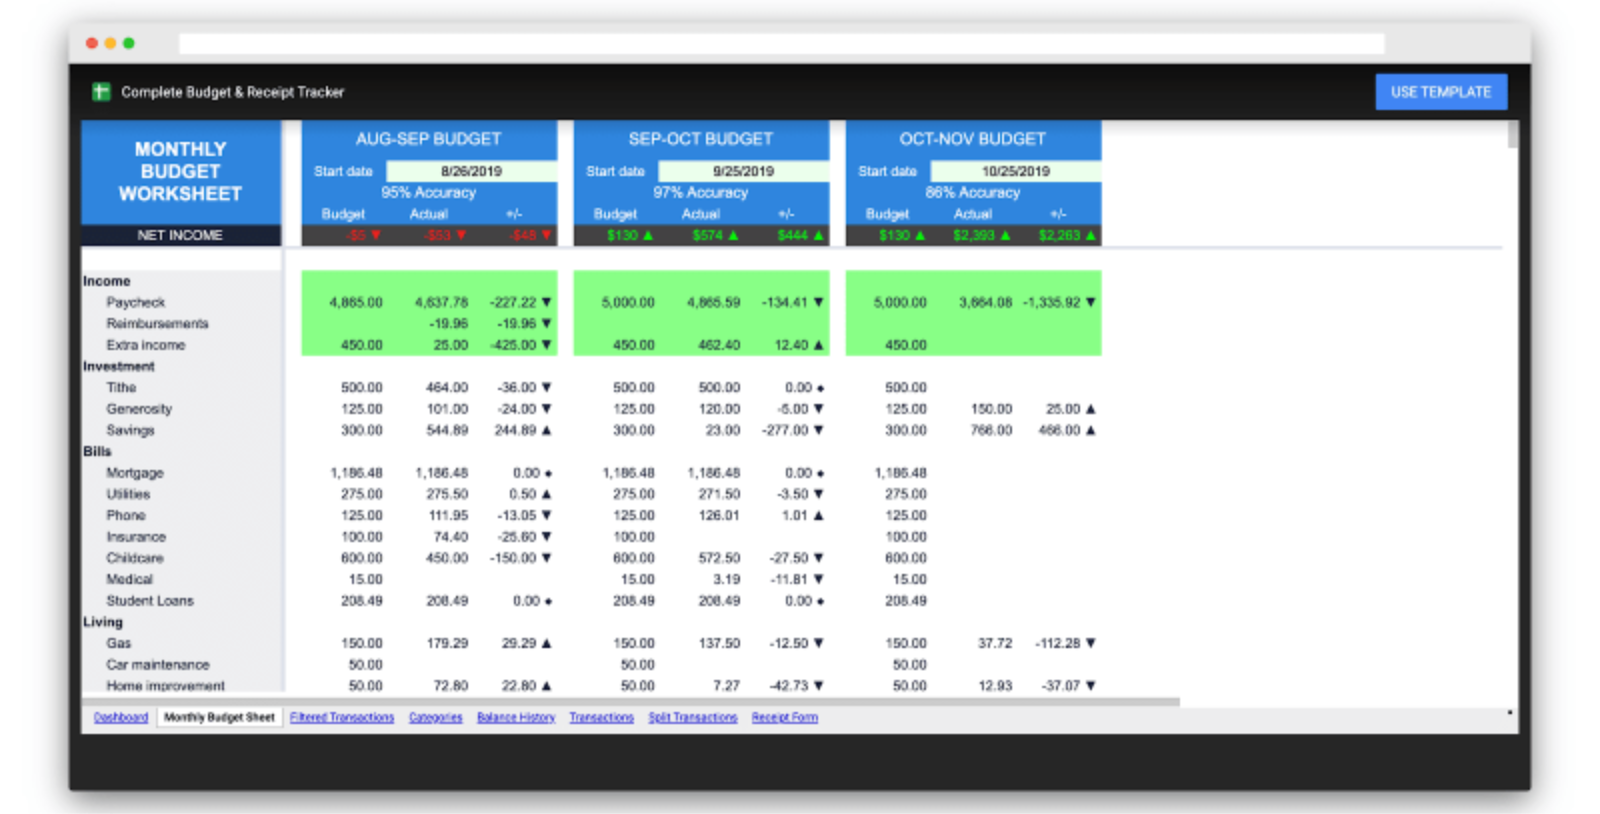
This tracker is a very comprehensive budgeting solution.
Highlights
- Instead of using the regular monthly budget calculations, this sheet offers the option to start your budget on any day of the month, like the day you get your paycheck.
- There’s also a sheet dedicated to split transactions. I liked the use of up and down arrows in the Monthly Budget Sheet to show quickly whether a category is over or under budget.
- There’s also a clever formula to gauge how accurate your monthly budget is.
Consideration
- There is a bit of a learning curve to use this solution, but the author provides a helpful 4-minute instructional video.
Plan and Track Your Daily Cash Flow
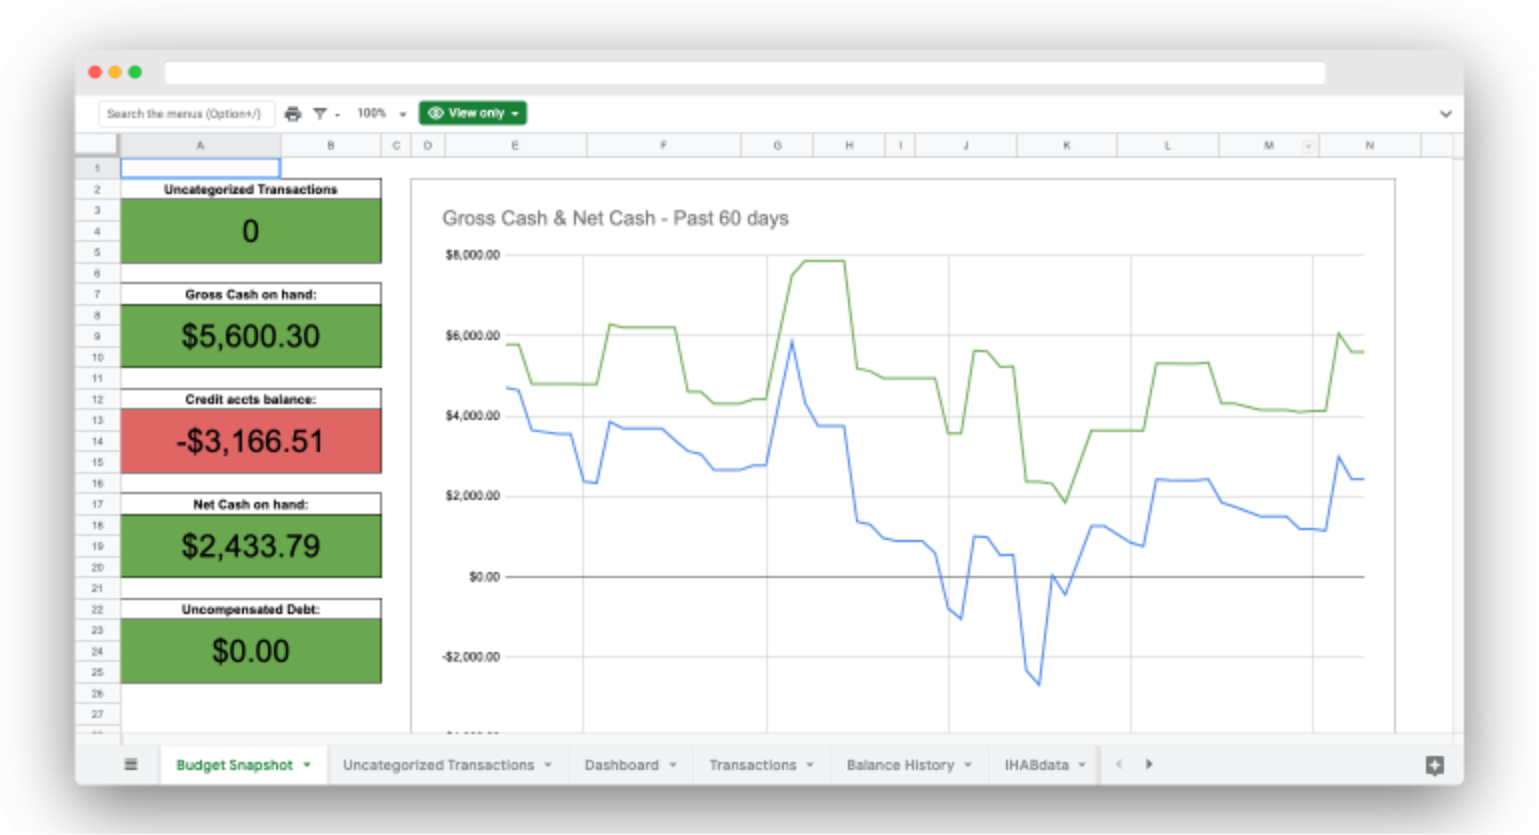
There is a lot going on behind the scenes in this solution. In addition to adding 3 sheets (Budget Snapshot, Uncategorized Transactions, and a Dashboard), this solution adds its own Menu tab and with multiple sidebar views.
Highlight
- It provides a bold display of key personal financial metrics.
Considerations
- To use it, you need to install and authorize custom scripts created by the author.
- Running scripts does create potential security and privacy issue.
- On a quick glance, the author’s scripts look very well written, but they run more than 1,000 lines of code so I wasn’t able to analyze everything. Of course, Tiller Labs also uses scripts within an add-on to perform work. When designing template solutions, we typically try to build without scripts whenever possible in service to transparency accessibility & user customization.
Easily Track Savings Split into Funds
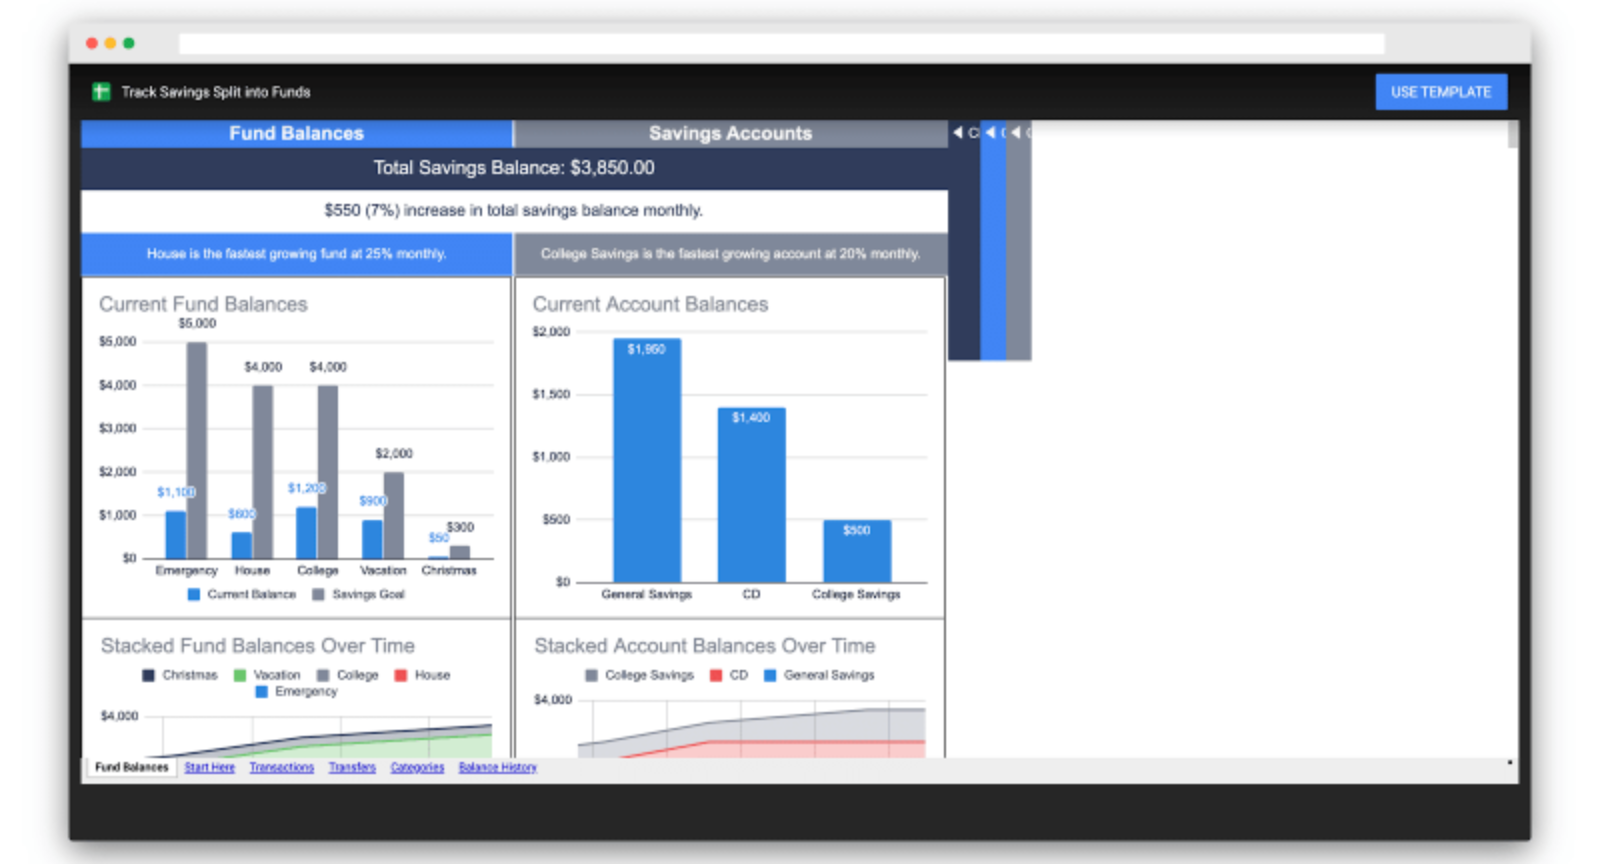
This is a very well-thought-out solution if you need to save for different things and track them separately— no matter whether you are using one or multiple savings accounts.
Highlights
- There is a helpful Start Here sheet and a very useful Fund Balances dashboard sheet.
- The expansion options in Columns C, F and R on the dashboard are a clever feature.
- The Transfer sheet lets you virtually transfer money between savings goals without having to make any actual transactions.
- The use of Tiller’s colors and styles makes these sheets look very much like a Tiller designed sheet.
EOM Tracker
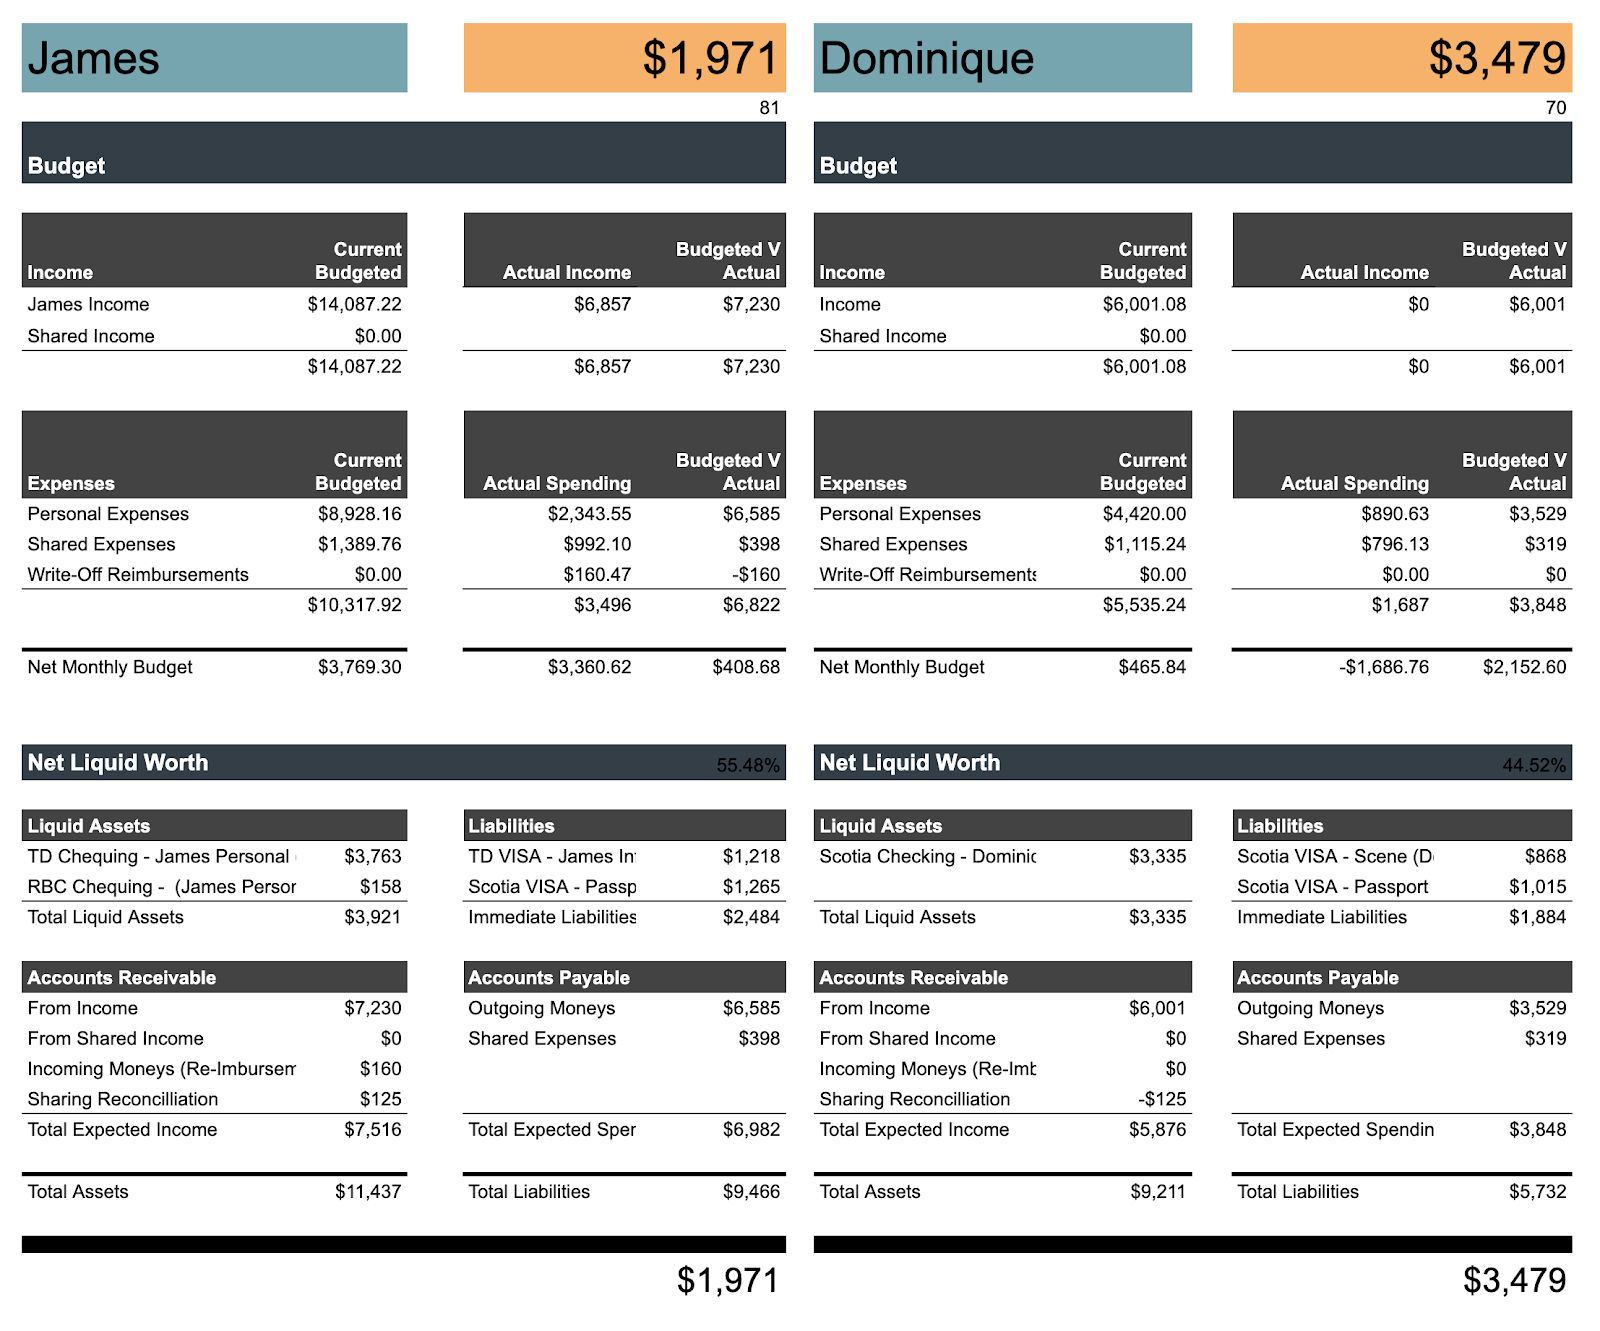
This entry creates a Custom Dashboard to help you reach your goal of a specific end-of-month net-liquid balance.
Highlight
- The sheet works for two people with separate and shared income and expenses.
Considerations
- It adds a few columns to Tiller’s Categories sheet such as Expense Class and Owner.
- The concept of the sheet is good, but some of the formulas are hard-coded with specific names, such as “James Income” and “Dominique Expense.” In order to use the sheet, you will need to find and manually replace some formulas.
Email a Daily Summary of Transactions Across Multiple Accounts

Tiller offers a daily email showing your transactions and balances… but this solution shows how that can be accomplished can be done for customers wanting more customized information in a daily email.
Highlight
- Great functional example of email automation.
Considerations
- Sending automatic emails requires the use of Google Scripts.
- The solution offered here is designed to work with the author’s accounts only. You will need to heavily modify it and have knowledge of how scripts work. This entry shows what is possible if you view
Tools -> Script Editorbut it won’t work for other users. In fact, it will try to send the email to the author, not you!
Budget and Financial Tracking System

This spreadsheet includes a grab bag of sheets with different ways of viewing your financial data.
Highlights
- The dashboard does a nice job of presenting charts and graphs of key data. The solution includes several sheets based on Pivot Tables that don’t require any formulas— see the IRA Data and Cash Flow Table sheets.
- These are good examples of what you can build just by using pivot tables.
Considerations
- The sheets use some pretty bright colors which some users might find a bit too much.
- Many of the sheets are hard-coded with the user’s data, so you would need to modify it to work with your own data.
Monthly Budget and Spending With Income/Expense Groups

This solution provides a unique way to track your monthly budget. For each month you want to track, you copy a template sheet and create a separate sheet.
Highlights
- You can track how you are doing for each Category and Expense Group.
- The sheet is similar to Tiller’s Monthly Budget, but it adds a Cash Spent column to manually add your cash spending.
- The author provides helpful documentation in the Community post.
Consideration
- The solution does require the use of a Google Script, but the script is pretty simple. (I wondered if there was a better way to achieve the same results without the script.)
Trend View - See the Big Picture

This entry provides an easy way to view your Income and Expense categories by month over the course of a year.
Highlights
- Tiller provides a Yearly Budget sheet but it can be hard to spot trends since it includes Actual, Budget, and Available columns for each month. This solution helps!
- This solution lets you select just one way to view your data at a time: either Budget, Actual or Difference.
- The spreadsheet makes use of a clever lookup table sheet to generate the right formulas very efficiently.
Considerations
- The categories are hard-coded so you would need to adjust the sheet for your own data.
- You need to put your monthly budget data into a separate Budget sheet.
Tiller Labs tease: We are working on a template that includes a similar concept. We hope to have it ready soon, so keep an eye out for it… 
Period to Date Budget Tracker with Rollover

This solution uses the Rollover Budgeting system and has a very clear and useful Budget Dashboard.
Highlight
- The spreadsheet also has a separate Account Reconciliation sheet which compares the current balance of each account from the balance history data with the balance based on the Transactions sheet data. I’m a big fan of using this approach. It’s normal to see slight differences between those numbers due to the timing of when transactions are recorded. But if differences persist, you may have a missing transaction or duplicate.
Consideration
- The categories are hard-coded into the sheet, so you would need to manually adjust the sheet to work with your own category list.
Bill Grid, Dashboard Module with Cash Forecast
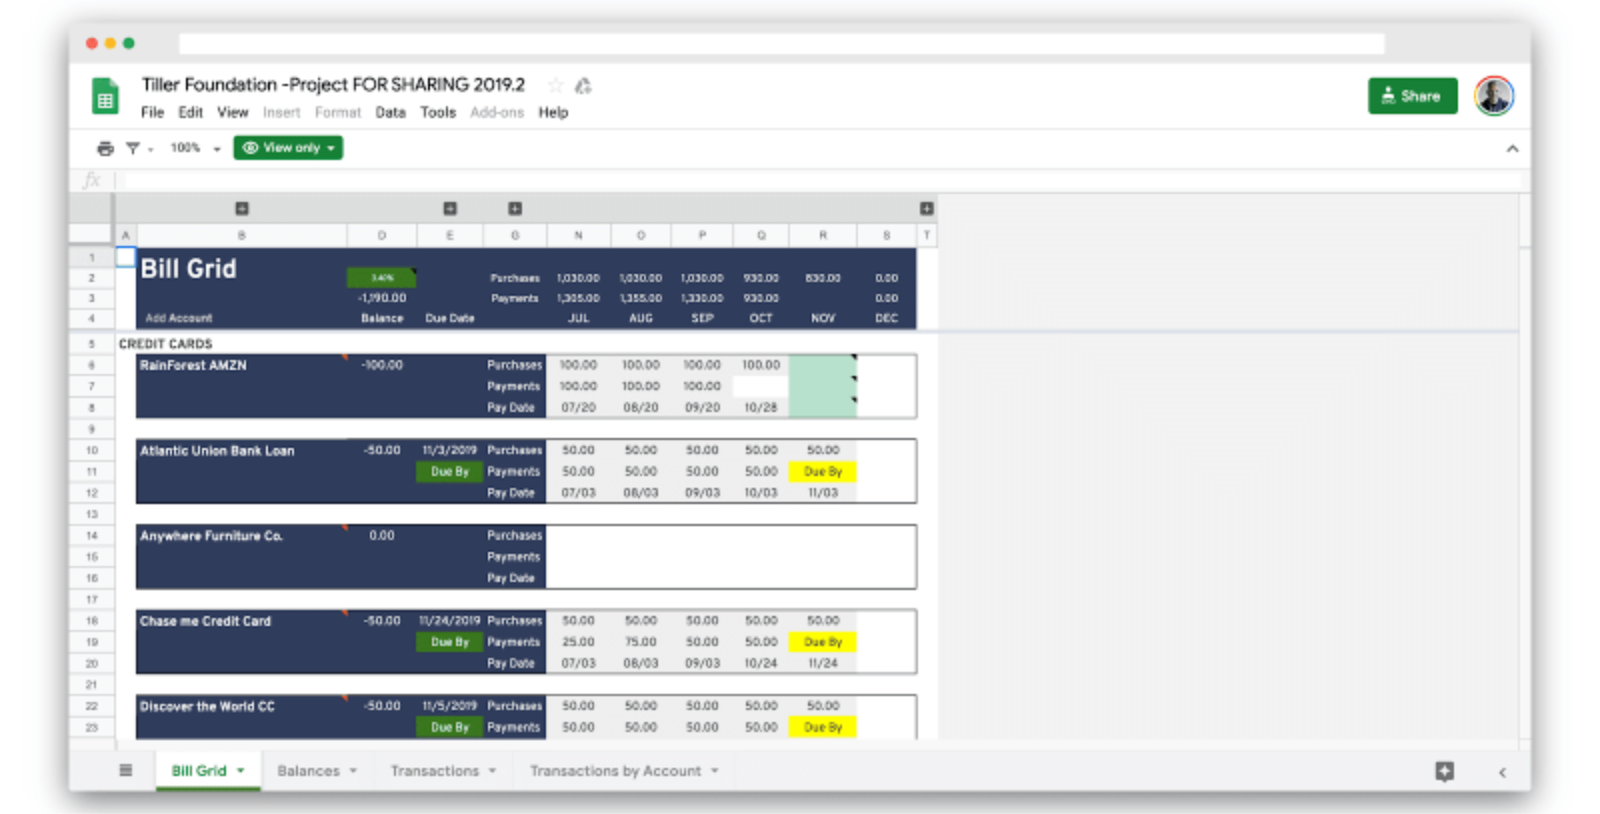
This spreadsheet is designed to give you great visibility into bill management.
Highlights
- Unlike other sheets that focus on budgeting, this one focuses on paying your bills.
- The Bill Grid sheet does a good job of showing the status of each of your bills.
- The sheet includes a Macro, found under the Tools button, to help you add additional bills if you run the macro on the Bill Grid sheet.
- There is a module added on top of the Balances sheet that lets you select which account you want to pay a bill from and then see what that will do to the account’s balance, making sure you have enough money in the account.
Considerations
- Running it with another sheet open didn’t work.
- There’s a bit of a learning curve to understand how it all works, but depending on your needs, it might be worth learning.
Envelope System - With Funding Templates
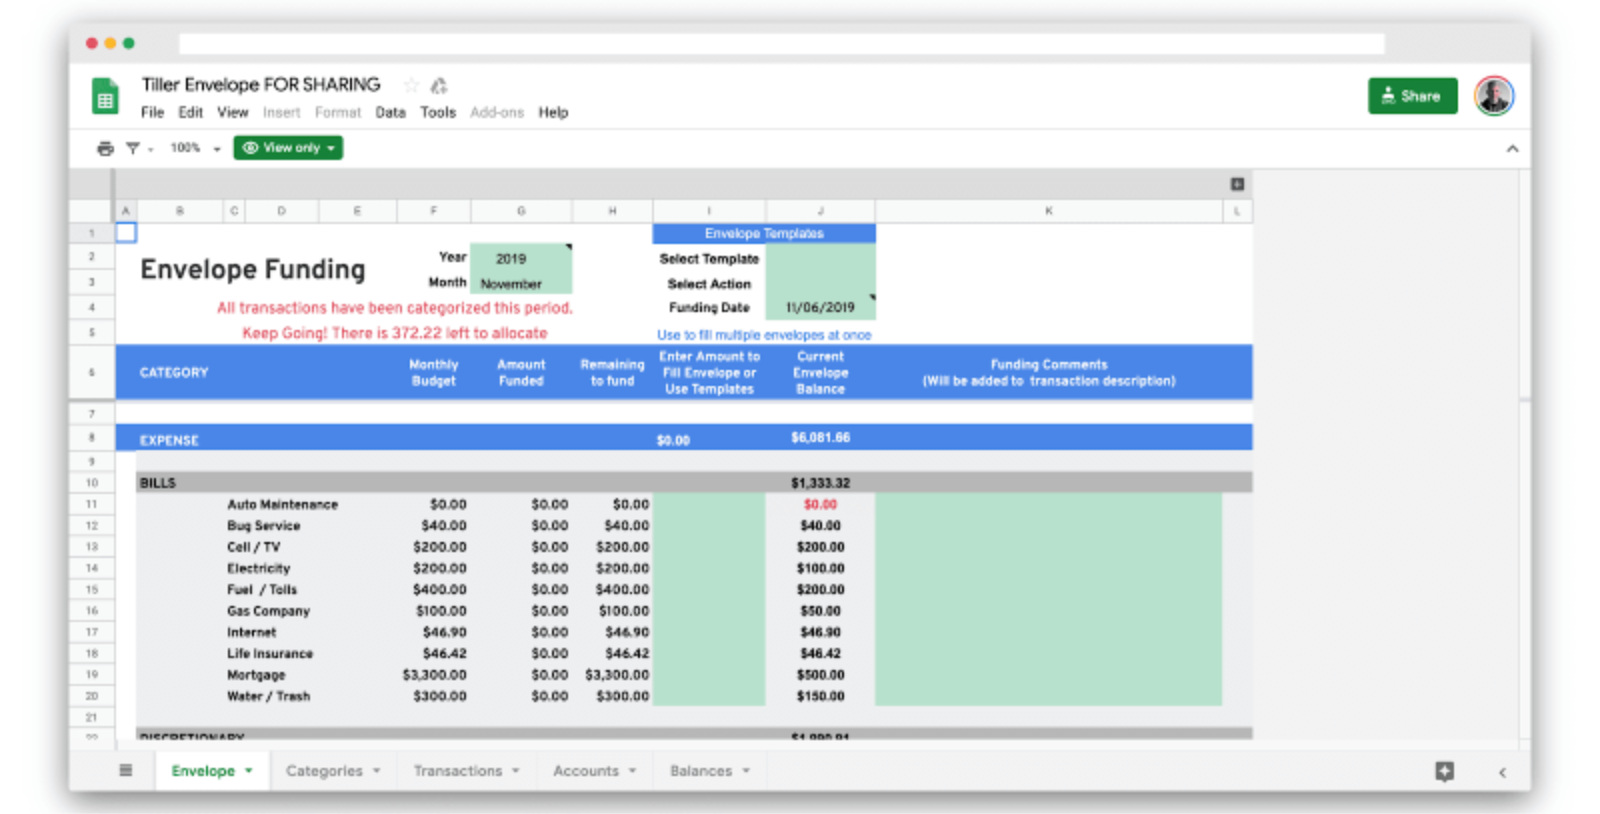
This entry is for fans of the envelope system of budgeting. Tiller has an envelope budgeting option but this author wanted a system that supported using templates and was easier to understand.
Highlights
- The solution includes an Envelope sheet that’s easy to follow and some extra columns added to the Categories sheet that allow different paychecks to be split in different ways.
- The sheet makes use of array formula functions that make it easier to expand when additional categories are added.
- Even though the author says he is “not a programmer or financial person, or anything fancy like that”, he has built a very functional envelope budgeting system.
Consideration
- Make sure to use the updated version of the sheet as some errors have been corrected.
Daily Budget vs Expenses

This spreadsheet helps you answer the simple question “How much is available to spend each day to break even by the end of the month?”
Highlights
- I can tell a lot of thinking has gone into making this sheet simple but useful.
- It features a Month sheet that shows a line graph of your cumulative spending over the month compared to a daily budget, which assumes equal spending every day.
- The Month sheet also shows all your bills and transactions for the month.
- I liked that the author’s sample sheet includes a budget for Interstellar Space Travel monthly, but I think it’s going to require more than their budget of $295 a month.
Consideration
- While much of the sheet is automated, you will need to manually add your own bills and adjust the budget formulas in Month!C42:C57 with budget amounts to get the sheet to work for your situation.
Recurring Expenses Dashboard

This solution focuses on tracking your recurring expenses.
Highlights
- It uses the solid theory that knowing much you need to spend on your recurring expenses will give you confidence in knowing how much you can spend on your discretionary purchases.
- The sheet builds off of Tiller’s Projected Balances sheet (which I happened to have built) and cleverly extends it with a separate Recurring Expense Dashboard.
- The author includes notes within cells to help use and understand the sheet.
Consideration
- The author suggests some workarounds for dealing with the limitations of the sheet, like making 3 categories for each of your 3 monthly trips to the Grocery store on different dates. That’s a bit awkward, but it works for the author’s purposes.
HSA Receipt Tracker
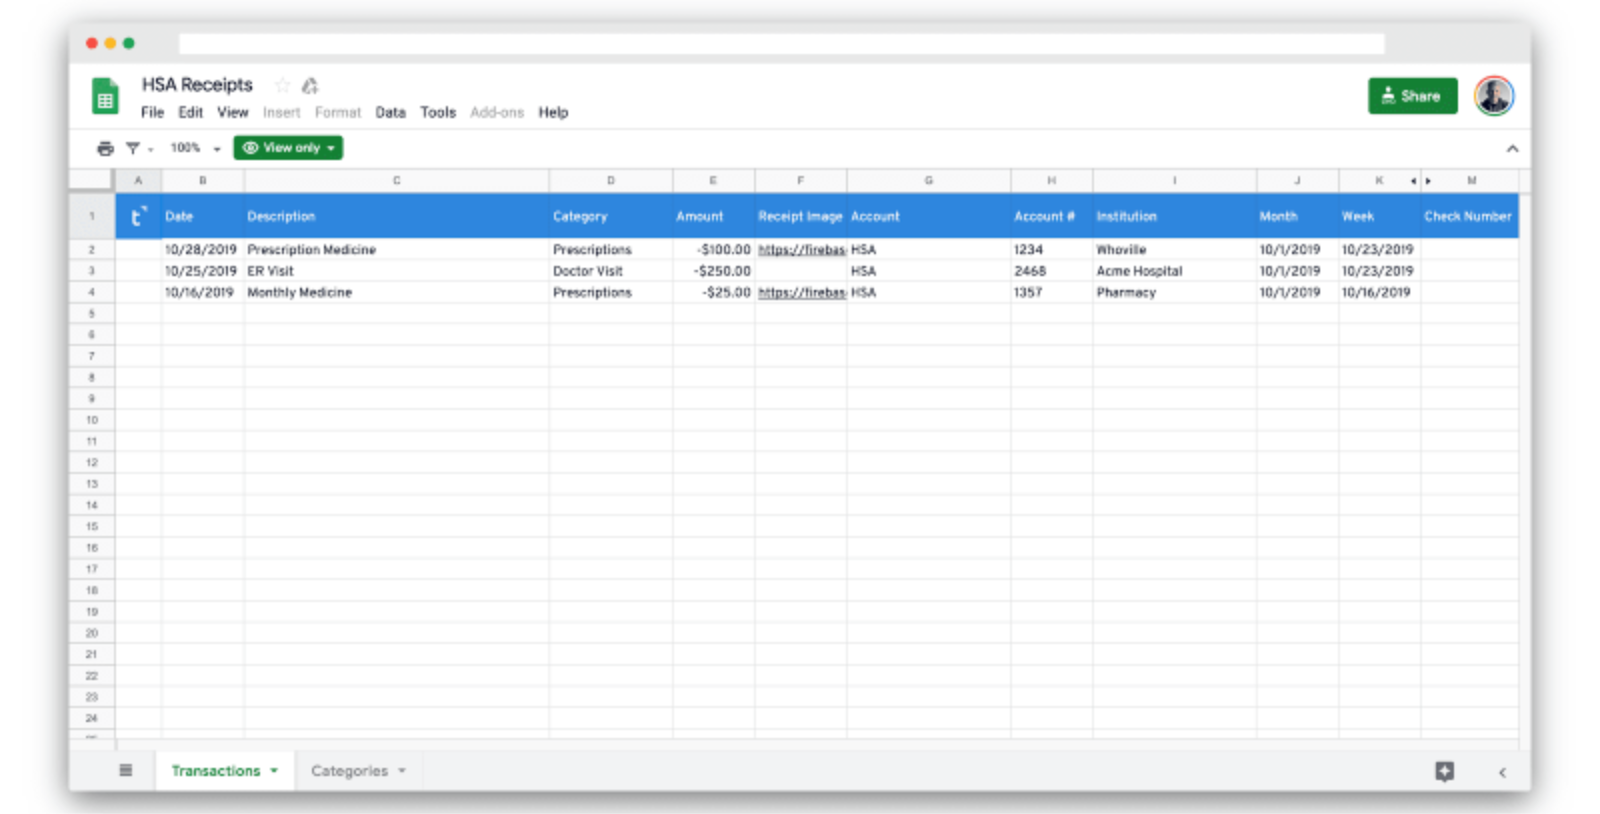
This entry is different than all the other contest entries. It only makes one change to Tiller’s sheets which is adding a Receipt Image column to the Transactions sheet. But the author also built a basic Gilde mobile app that lets you view transactions and add photos of receipts from your phone. Google sheets like Tiller are not optimized for mobile devices and I’ve written about how Tiller and Glide can work together.
Highlight
- While the solution is called HSA Receipt Tracker, it could easily be used to track any receipt.
Considerations
- A more complete HSA Tracker solution would include a sheet that shows all your HSA category transactions.
- You could also use a Filter on your Transactions sheet to show only HSA transactions as well.
How Much Can I Spend Today? Cash Flow, Budget, Bills, Debt, and Savings Tracker

This is a very comprehensive solution built by a Certified Financial Planner.
Highlights
- There’s a helpful guide on the first sheet to get you going.
- The solution features a Dashboard that answers the question “How Much Is Left To Spend This Month” in large text at the top, in addition to many line charts, bar graphs, and data tables.
- The solution also shows you how three different debt payoff strategies compare for your individual situation.
- The sheets use the concept of fixed vs flex expenses.
Considerations
- There is a learning curve to setting up and using this spreadsheet, but it also provides many different ways to slice and view your financial status.
- Some of the formulas are hidden using white text and narrow columns so it’s not easily transparent to understand how it works.
Shared Budget Manager
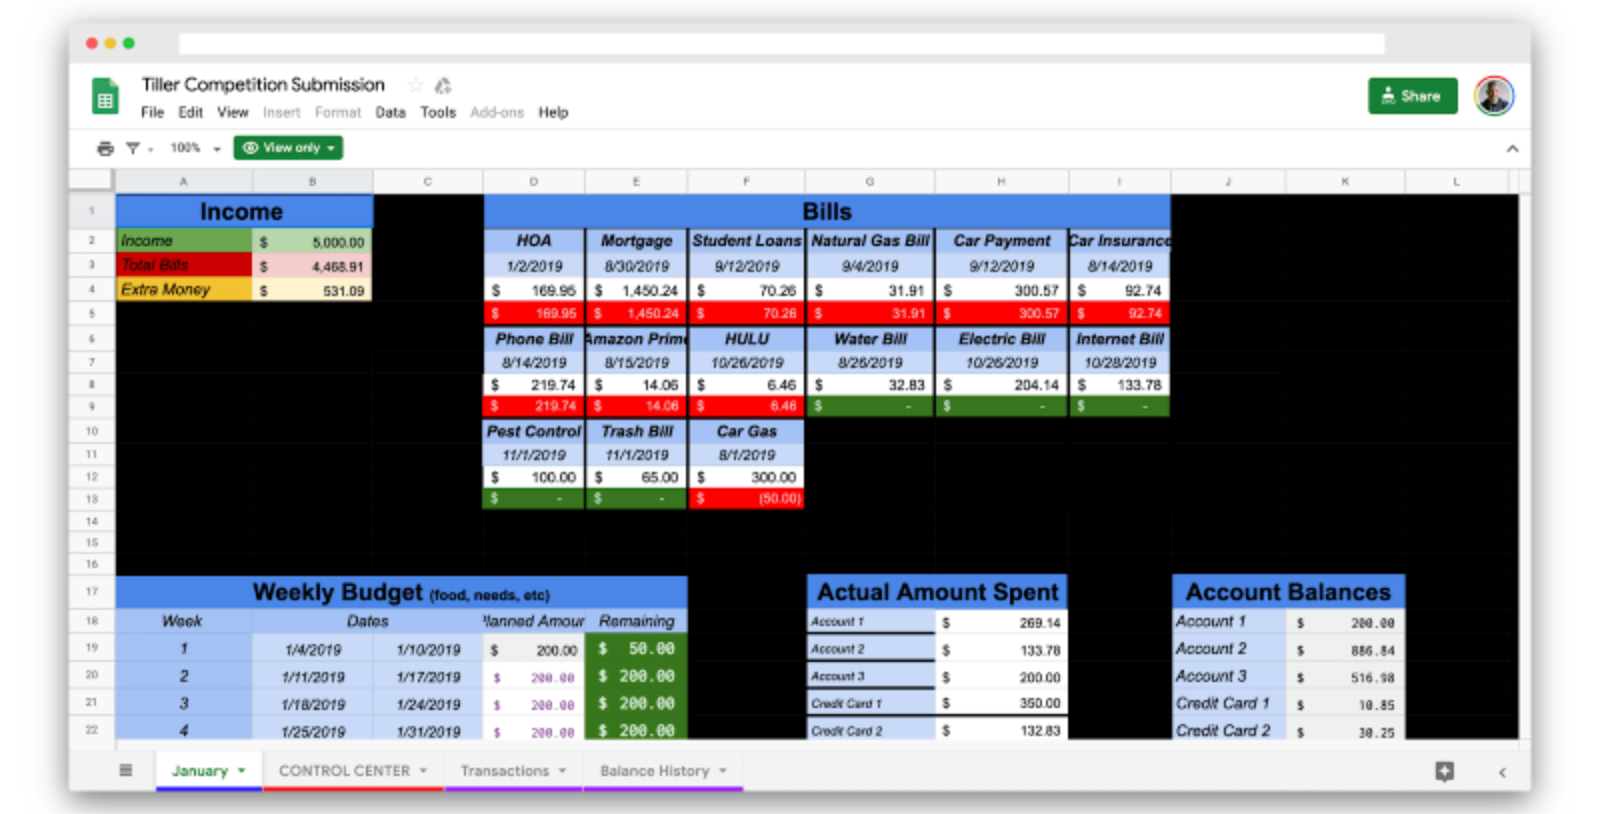
This entry is designed to help couples keep track of their shared bill paying and budget. It features a sheet named for the month showing your monthly bills and their payment status.
Highlight
- This dashboard page also shows weekly budgets, actual spending and account balances.
Considerations
- While some of the sheets use formulas, you have to manually enter the start and end dates of each week in the month.
- You can add additional Bills in the dashboard by copying and pasting but then you will need to manually adjust the formulas to match them up with the Category cell in the Control Center sheet.
Everyday Trends - Monitor Net Worth, Cash Flow, Budget, Pace (Mobile Friendly)

This solution provides a very clean and visual view of many of your key personal financial metrics.
Highlights
- It makes great use of charts, graphics,
SPARKLINE(), and tables. - The Overview sheet lets you drill down into your Spending Category groups by expanding the rows.
- Much of the Overview sheet is driven by an extensive Pivots sheet which uses some formulas and lots of pivot tables.
Consideration
- If you add more categories than the sample sheet, you will need to reposition the Pivots sheet or else you will see
#REF!errors.
Balance Tracker

The Balance Tracker has one simple goal: show a line graph for the balance of one of your accounts based on a start date.
Highlight
- The sheet uses a dropdown to select the start date and which column (account or account grouping) you want to graph. This resulting chart shows up all the way on the right of the sheet.
Considerations
- To improve the sheet, I’d consider placing the chart in the main and center part of the sheet and move the pivot table of account balances lower down.
- The sheet also features mini-
SPARKLINE()views for each account, but they don’t use the same dollar scale and show the entire date range of balances. - The sheet shows what’s possible using a pivot table and chart, but you might consider some improvements for improved usability.